As I continue to add more devices to my SmartThings Hub, I’ve come to realise the importance of regularly reviewing the well-being of my smart home. I want to be sure that all my devices and rules are operating as expected, to be able to identify any problems, and to review historical trends which could lead me to develop further optimisations.
The SmartThings GUI enables us to review the instantaneous state of our smart home devices, it also allows us to review the recent history for individual devices via the event feed, but to carry out a detailed analysis of system events over longer periods of time we need to use third-party tools. In this post I present a walk-through of how to build a server to store SmartThings event data and how to visualise that data using charts and dashboards.
Overview
There are three key components to the solution:
- SmartThings Hub: Samsung’s home automation controller. Since you’re reading this article I’ll to assume you’re already reasonably familiar with this platform. To get data out of SmartThings we’re going to use a custom SmartApp, more on that later.
- InfluxDB: A free open-source distributed database for managing IoT time-series data. It’s super-easy to install and natively supports compression, retention policies, and down-sampling.
- Grafana: A free open-source platform for visualising time series data. Grafana makes it easy to create dashboards and charts. As well as InfluxDB, it works with several other data sources such as Graphite, Elasticsearch, and OpenTSDB.
Installation
For this solution I’m using Ubuntu Server 14.04 running in a virtual machine, however you could substitute this with a Raspberry Pi running Raspbian, or any other Linux distribution of your choice. If you’re not using Ubuntu or another Debian-based distribution you will need to use different commands to those shown below, follow the links to the official installation instructions for more information.
Installing InfluxDB
At the time of writing, the latest version of InfluxDB is v0.10, and the official installation instructions can be found here.
We’re going to be using the apt-get package manager to install InfluxDB, so the first step is to add the InfluxData key and repository:
~$ curl -sL https://repos.influxdata.com/influxdb.key | sudo apt-key add -
~$ source /etc/lsb-release
~$ echo "deb https://repos.influxdata.com/${DISTRIB_ID,,} ${DISTRIB_CODENAME} stable" | sudo tee /etc/apt/sources.list.d/influxdb.list
Next, update the apt repositories and install InfluxDB:
~$ sudo apt-get update
~$ sudo apt-get install influxdb
Start the InfluxDB service:
~$ sudo service influxdb start
To verify InfluxDB is up and running we can run the influx CLI:
~$ influx
Visit https://enterprise.influxdata.com to register for updates, InfluxDB server management, and monitoring.
Connected to http://localhost:8086 version 0.10.1
InfluxDB shell 0.10.1
>
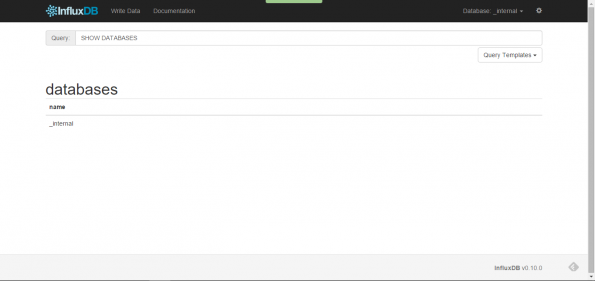
We can also browse InfluxDB’s web interface on port 8083, http://localhost:8083/:
Next, we need to create a database for SmartThings and a user account for Grafana. From the InfluxDB CLI, issue the following commands (obviously, replace password with something a little more secure):
> CREATE DATABASE "SmartThings"
> CREATE USER "grafana" WITH PASSWORD 'password'
Installing Grafana
At the time of writing, the latest version of Grafana is v2.6.0, and the official installation instructions can be found here.
We’re using the apt-get package manager again, so the first step is to add the Grafana key and repository:
~$ curl https://packagecloud.io/gpg.key | sudo apt-key add -
Add the following line to /etc/apt/sources.list:
deb https://packagecloud.io/grafana/stable/debian/ wheezy main
Next, update the apt repositories and install Grafana:
~$ sudo apt-get update
~$ sudo apt-get install grafana
Start the Grafana service:
~$ sudo service grafana-server start
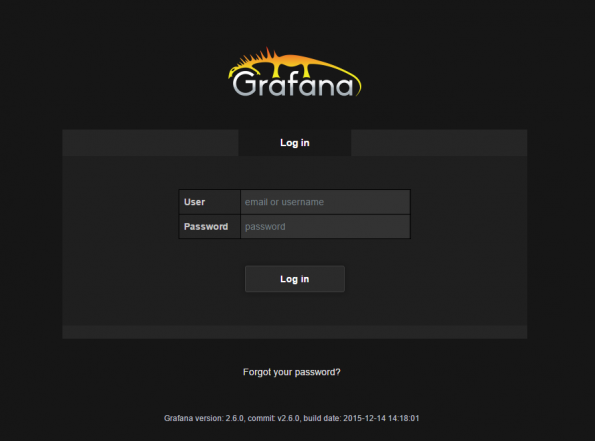
We can verify Grafana is running by browsing to the web interface on port 3000, http://localhost:3000/:
To configure Grafana to start automatically at boot time, execute the following command:
~$ sudo update-rc.d grafana-server defaults 95 10
At this point, I also recommend customising the Grafana configuration file (/etc/grafana/grafana.ini). In particular, we should change the admin user’s password, and if our server is going to be private, disable user signup: allow_sign_up = false
So far, so good. We now have InfluxDb and Grafana running, but before we can start constructing some charts and dashboards, we need some data…
Installing the InfluxDB Logger SmartApp
To get data from SmartThings into our InfluxDB database, I’ve written a custom SmartThings SmartApp. Once installed, we can use this SmartApp to subscribe to the devices we want to monitor and it will send data to InfluxDB using its HTTP API. The SmartApp uses the hubAction command, which means it will support the InfluxDB server being on the same private LAN as our SmartThings Hub, so there is no need to make the logging server accessible from the internet.
Follow the instructions here to install the InfluxDB Logger SmartApp in the SmartThings IDE.
Important: For the InfluxDB Logger to resolve group (i.e. room) names and pass them as tags to InfluxDB then we must manually edit the SmartApp code before publishing. Find the definition for the command getGroupName() and replace the XXXXXXXX-XXXX-XXXX-XXXX-XXXXXXXXXXXX strings with the unique group IDs for your SmartThings location.
/**
 * getGroupName()
 *
 * Get the name of a 'Group' (i.e. Room) from its ID.
 *
 * This is done manually as there does not appear to be a way to enumerate
 * groups from a SmartApp currently.
 *
 * GroupIds can be obtained from the SmartThings IDE under 'My Locations'.
 *
 * See: https://community.smartthings.com/t/accessing-group-within-a-smartapp/6830
 *
 **/
private getGroupName(id) {
    if (id == null) {return 'Home'}
     else if (id == 'XXXXXXXX-XXXX-XXXX-XXXX-XXXXXXXXXXXX') {return 'Kitchen'}
     else if (id == 'XXXXXXXX-XXXX-XXXX-XXXX-XXXXXXXXXXXX') {return 'Lounge'}
     else if (id == 'XXXXXXXX-XXXX-XXXX-XXXX-XXXXXXXXXXXX') {return 'Office'}
     else {return 'Unknown'}
}
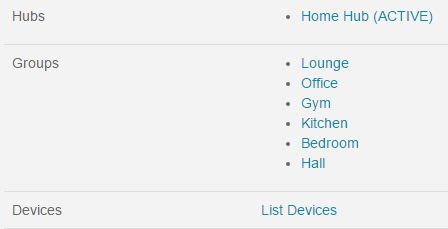
Room IDs can be obtained from the My Locations tab of the SmartThings IDE. Scroll down to the Groups section and hover over the links to each room. The room ID is contained in the URL for the room:
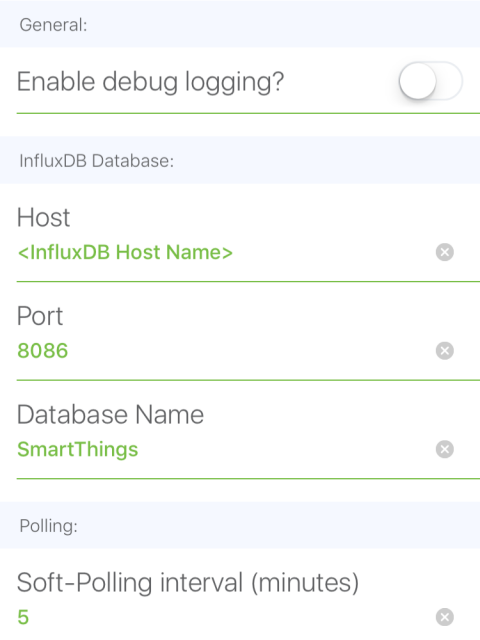
Once we’ve published and installed the InfluxDB Logger from the Marketplace, we must configure it. Enter the host name and port of the InfluxDB server (note that the InfluxDB HTTP API uses port 8086 by default, whereas the web interface uses 8083). Additionally we must specify the database name we created above.
The InfluxDB Logger also allows us to configure a Soft-polling interval. If enabled, this will cause the attributes of all devices to be sent to the InfluxDB database on a periodic basis. I implemented this feature because SmartThings will only generate an event when a device attribute actually changes in value. For attributes that don’t change very often, this can lead to big gaps in the data series, which in turn can lead to gaps in our Grafana charts. For now, I recommend setting the soft-polling interval to 5-10 minutes.
Finally, we must configure the devices we want to monitor. When finished, press Done.
Verifying Data Logging
The InfluxDB Logger SmartApp should now be sending events to InfluxDB via HTTP, we can verify this by checking the SmartThings logs and by running a query from the InfluxDB CLI.
From the SmartThings IDE, navigate to the Live Logging tab. After a few minutes, we should see some info events from the SmartApp, corresponding to changes of device attributes:

From the InfluxDB CLI we can query data in the database directly using the InfluxQL query language. Remember to set the database first using the use command first. For example, to query switch measurements:
> use SmartThings
> SELECT * FROM switch
name: switch
------------
time                deviceId                              deviceName             groupName     unit       value     valueBinary
1460400903900824163 xxxxxxxx-xxxxx-xxxx-xxxx-xxxxxxxxxxxx En-suite Towel Rail    Bedroom       switch     off       0
1460401204143438152 xxxxxxxx-xxxxx-xxxx-xxxx-xxxxxxxxxxxx AV Power               Lounge        switch     off       0
1460401204169860754 xxxxxxxx-xxxxx-xxxx-xxxx-xxxxxxxxxxxx Computer Power         Office        switch     on        1
We can see above that the InfluxDB Logger maps device attribute names (e.g. switch or power) to a measurement name in InfluxDB. Additionally, deviceId, deviceName and groupName (i.e. room name) are added as tags. Device attribute values are mapped to the value field. In cases where an attribute value can also logically be represented as a binary value, then an additional field called valueBinary is also included. E.g. for a switch; off = 0 and on = 1. We will see later how these additional tags and fields are useful when building charts and dashboards in Grafana.
If you want to learn more about querying data using the InfluxQL query language, you can find a guide here.
Now we have data in our database we can begin building charts using Grafana. Happy days!
Configuring Grafana
To configure data sources, dashboards, and charts we must use the Grafana web interface on port 3000, http://localhost:3000/.
We will first need to login using the admin password that we configured earlier. Once logged in as admin you may wish to create additional users from the Grafana admin menu.
Data Sources
Next we need to define a data source that corresponds to our InfluxDB database. Click on Data Sources, and then Add New.
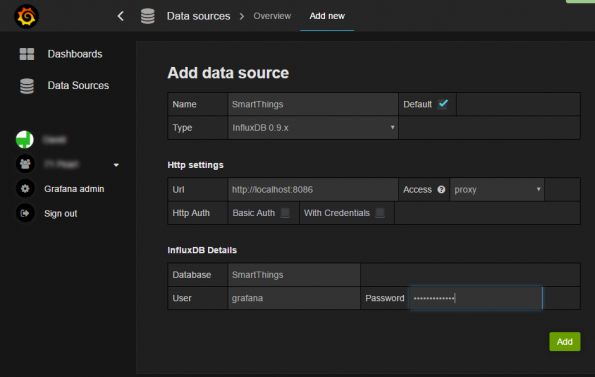
The data source type should be set to InfluxDB 0.9.x and the URL should point to our InfluxDB instance on localhost:8086. Set the database name to SmartThings and the username and password to what we set earlier. Save and test the connection.
We can now begin using the Dashboards section…
Dashboards
Grafana supports the creation of multiple dashboards. Each dashboard can contain any number of graphs, tables, stats, and text panels.
Create a new dashboard from the top menu, give it a name, then click +Add Row to add a row to the dashboard.
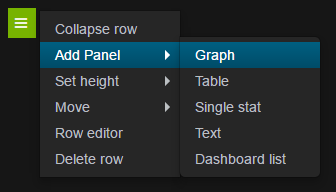
Let’s start by adding a graph to our dashboard. From the row menu select Add Panel and then Graph:
Graph Panel
We are first presented with the Metrics tab of our new graph. In the bottom-right corner, ensure the data source for the graph is set to SmartThings. We should find a drop-down menu of available measurements when we click on Select measurement. In this example I’ve selected temperature:
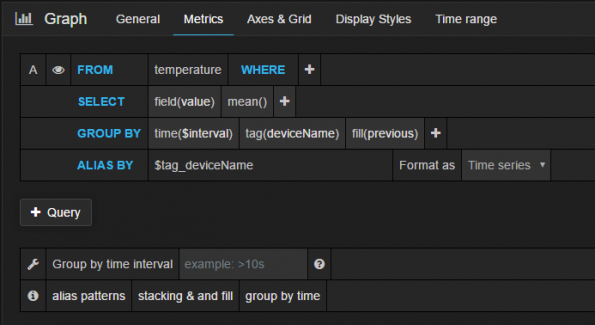
If we have multiple devices with temperature attributes, we can add the tag deviceName into the GROUP BY clause, which will create an individual data series for each device. Additionally, I’ve specified the deviceName tag in the ALIAS BY clause above so that each series name matches the device name. We end up with a chart looking something like this (obviously we have to wait a while for multiple data points to be logged):
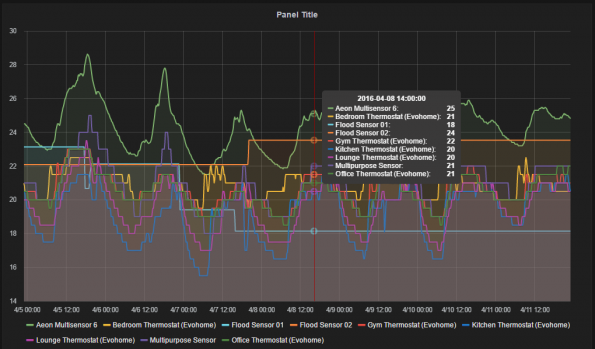
Grafana supports a wealth of graph settings, most of which should be self-explanatory. We can customise the graph’s title, axes, legend, generate aggregate values, and overlay data series from multiple devices and measurement types. For the time being I’ll leave you to experiment.
In future posts I’ll share some of the more-advanced charts and dashboards I’ve created, including use of the templating and annotation features. We’ll also look at configuring data retention policies and down-sampling data in InfluxDB.
Wrapping Up
I hope you’ve enjoyed my first ever blog post and that you’ve found it useful. I’d love to hear your feedback so please don’t hesitate to use the comment form below.

Thanks for the guide; helped me a lot! 🙂
The following line is incorrect:
Start the Grafana service:
~$ sudo service influxdb start
Correct – “sudo service grafana-server start”
Thanks, I’ve updated the article.
Great write up, do you know if this works with influxdb v.0.13? I can see the connections to my influxdb server over port 8086, but it doesn’t appear to post any data to my database. Is there a way to see what’s in the body before the XPOST? Thanks!
Thanks Chris. If you log into the SmartThings IDE and navigate to the ‘Live Logging’ tab you should see some lines appear like ‘postToInfluxDB(): Posting data to InfluxDB:…’ each time the SmartApp attempts to send data. The bit after ‘Data:’ is the body (minus the square brackets). Check if your device names contain any apostrophes as these are not escaped properly and will cause problems atm (I should fix this sometime).
Thanks! I actually posted the raw data from the live logs using curl and it worked fine. When I moved my server to the same layer 2 network as the hub, it now works via the app. What’s strange is that I could see the traffic reaching it with tcpdump, but the headers appeared empty. Not sure why it wouldn’t work over layer3, but it could be a weird mikrotik thing. In any case, it’s no big deal for me to move to the same segment.
I think I may be having the same issue – I can see the packets from hub hit my influx box, but nothing is logged to the database. Moving it to the same segment isn’t possible in my case as it’s running on a cloud-hosted server. Any thoughts on how I might troubleshoot this?
Got this up an running on a Raspberry Pi3 graphing all kinds of useless (per my wife) stats. Totally awesome and I love it. Thank you for all your hard work!
I did the same thing with my Pi. I love it!
This is great. Thanks.
I’m interested in your follow-up posts. I hope you still get to them.
“In future posts I’ll share some of the more-advanced charts and dashboards I’ve created, including use of the templating and annotation features. We’ll also look at configuring data retention policies and down-sampling data in InfluxDB.”
I want to second that. Hmmm.Three years later and still no follow up. It doesn’t look promising.
Awesome write up. Very easily portable to macOS just need to replace sudo apt-get with brew install.
Quick question though, would it be okay to set it up to poll every minute instead of every 5 minutes or would that be polling too often?
Soft-polling every minute should be feasible, but it really depends on how many devices and attributes you are monitoring. Keep an eye on the InfluxDB server load by monitoring the httpd measurements in the _internal database. Look out for things like clientError, serverError, and pointsWrittenFail, which might indicate your server is overloaded.
E.g.
SELECT non_negative_derivative(mean(“pointsWrittenFail”), 1m) FROM “httpd” WHERE $timeFilter GROUP BY time($interval) fill(null)
On the SmartThings side, keep a look out in the IDE logging for execution timeout errors.
Awesome! This is really cool! I do have one question. Shouldn’t I need to auth to the HTTP endpoint for influxdb? It seems I need to expose it somewhere? I’m not receiving any data, though I don’t see any failures in the logs.
Ok so pebkac for part of this, I had a firewall I forgot about on the influxdb server. Still would be nice to auth for the influxdb api
Noted. Adding support for security is in the to-do list. I think some has added basic security in a github fork, though I haven’t had time to look at it myself.
this is awesome. i got it running this morning. I will be cancelling InitialState soon. THANKS
Thank you I really like this setup.
I am having some issues.
I am using influxdb 1.3.2 and grafana 4.4.3 on debian stretch
I occasionally get good data posted to influxdb. This is from the smartthings ide logs
2fba5d8c-b9c0-4460-a9f8-13f2e01ef393 7:22:05 PM: debug postToInfluxDB(): Posting data to InfluxDB: Host: 192.168.1.148, Port: 8086, Database: SmartThings, Data: [_stLocation,locationId=”ab189ed7-66a8-48f4-a5d2-c238d8a5f2f6″,locationName=”Home”,latitude=33.98198700,longitude=-118.33837000,timeZone=”America/Los_Angeles” mode=”Home”,hubCount=1i,sunriseTime=”06:13″,sunsetTime=”19:44″]
Ever 2 out of 3 posts fail.
2fba5d8c-b9c0-4460-a9f8-13f2e01ef393 7:22:13 PM: error postToInfluxDB(): Something went wrong! Response from InfluxDB: Headers: [content-length:348, request-id:b8c48314-7fcd-11e7-8170-000000000000, http/1.1 400 bad request:null, content-type:application/json, date:Sun, 13 Aug 2017 02:18:40 GMT, x-influxdb-version:1.3.2], Body: {“error”:”unable to parse ‘_stHub,locationId=\”ab189ed7-66a8-48f4-a5d2-c238d8a5f2f6\”,locationName=\”Home\”,hubId=\”e2e18054-8a93-472c-a265-f8ed7a671428\”,hubName=\”Home\\ Hub\”,hubIP=\”192.168.2.100\” status=\”ACTIVE\”,batteryInUse=1i,uptime=nulli,zigbeePowerLevel=-2i,zwavePowerLevel=\”full\”,firmwareVersion=\”000.013.00013\”‘: invalid number”}
Any ideas?
First off, thanks for a great resource. I was able to set things up without a hitch. I added a sensor and want to start logging from it as well. I can’t seem to get the new sensor integrated into the logging framework. What’s the right way to add a new sensor? Do I need to wipe out my Influx database and start from scratch? Can I leave the Influx database as is and just run the InfluxDB logger application? When running the Influx DB logger application do I need to indicate all sensors to be logged as if I was starting from the beginning or should I just add the new sensor?
This is brilliant. Thanks for the hard work on it.
Hi,
I did all the installation procedures and receive errors on IDE Live Logging:
46ae9d85-72d6-4b61-a12e-58d188039a8d 16:05:01: error postToInfluxDB(): Something went wrong when posting: groovyx.net.http.HttpResponseException: Bad Request
error postToInfluxDB(): Something went wrong when posting: java.lang.IllegalArgumentException: Response does not contain data
Any help?
Thanjs
Super useful. Thank you so much for sharing! I got it up and running very quickly with no hiccups using your instructions. Thanks again.
Influx appears to be $249 p.a. is there not a free version?
For the “something went wrong” guys – go into the SmartApp config in your phone and turn off “Log Hub Properties” and you’ll be in business!
Just wanted to drop in to say thanks for your work on this. Much appreciated!
I have this up and running and its been collecting data for a couple of day now. I have been building out my dashboards in Grafana and its working great. I loaded all of this inside of a Docker Container running on my Synology NAS. This morning I noticed an unusual amount of CPU and Ram being used so I investigated, found that Influx DB was eating up half of the available CPU/RAM available to Docker. Does anyone know if this is a normal event? Does influx run well on HDD vs SSD?
Thanks for making this app – this is awesome.
Is there any reason you recommend such a low soft polling time? I am brand new to SmartThings and still figuring things out. Could setting a shorter polling time, like one minute, create issues or is this fine?
Could this be run on a RasperryPi Zero W ?? Im trying and ahve gottent ot eh step to verify if Grafana is installed. I open localhost:3000 in a browser…and it opens as if Grafana is running, but the page is blank… no login. Same if i open from a remote PC on the lan.
Still a useful article and plugin, thank you! Would love to see more of the dashboards you’ve created, that’s my next time-sink task.
This is awesome! I’m struggling with one thing – after installing it in the ST IDE and adding the Smart App (and configuring for Inlfux), I get softpoll() and handleevent() but never get a posttoinflux() event. Any ideas where to start troubleshooting? The groups are correct, and all of the other code is unchanged. Influx is fine, it works with many other things. It’s got to be something about the SmartApp or the command to my hub to post, but I’m stumped.
Thank You for this great writeup.
I am able to get my Smartthings data into InfluxDB and am able to querry my results there.
For ex:
SELECT mean(“value”) FROM “temperature” WHERE time >= now() – 6h GROUP BY time(10m), “deviceName” fill(previous)”
gives me data for all my devices in SmartThings.
However my Grafana query does not result any data.
Can you help?